Reading results
What a solved scenario is telling you, where every number came from, and how to tell a verified number from an estimated one.
A solve gives you a number, the KPIs around it, and a record of how it was produced. This page covers how to read all three, and how to tell how much weight a given figure will carry.
The scoreboard


The strip across the top of Scenarios carries two stats:
- Base — the model's baseline objective. A model that minimizes cost reads as a positive cost figure, never a negative profit. Where there is no figure, the strip shows — rather than a zero.
- Scenarios solved —
{n}of{total}. The count includes scenarios that ran but have since gone stale, because running one was work you did.
There is no "best" stat. Which what-if won is a conclusion for you to draw from the numbers, and scenarios have no chronology to trend.
KPI tiles
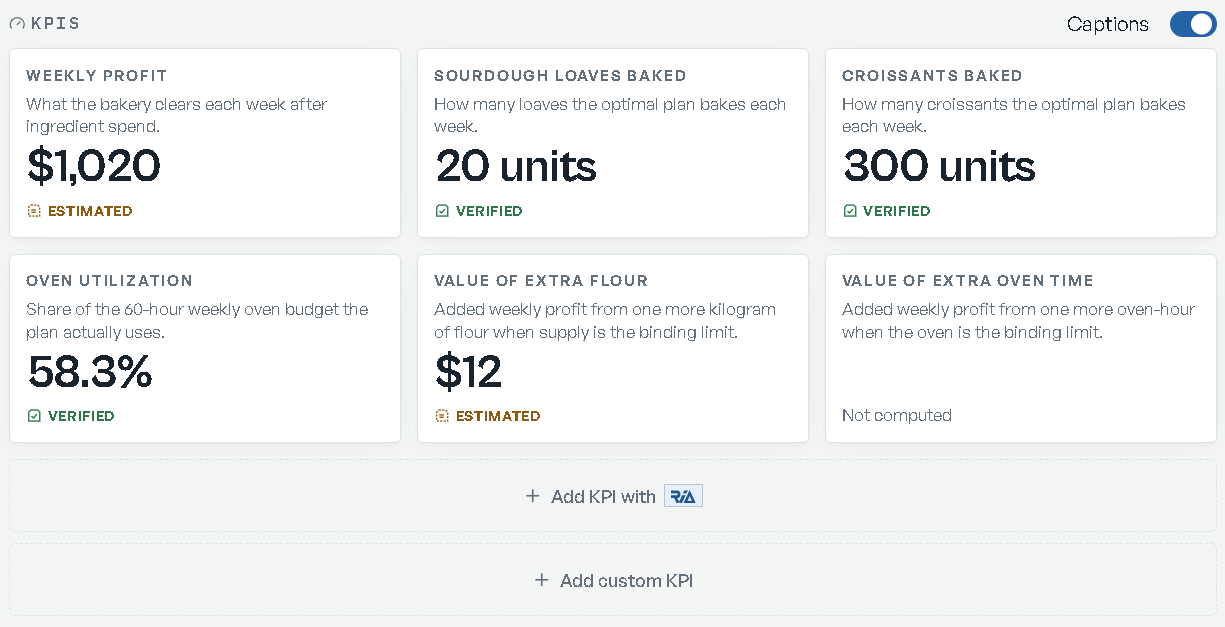
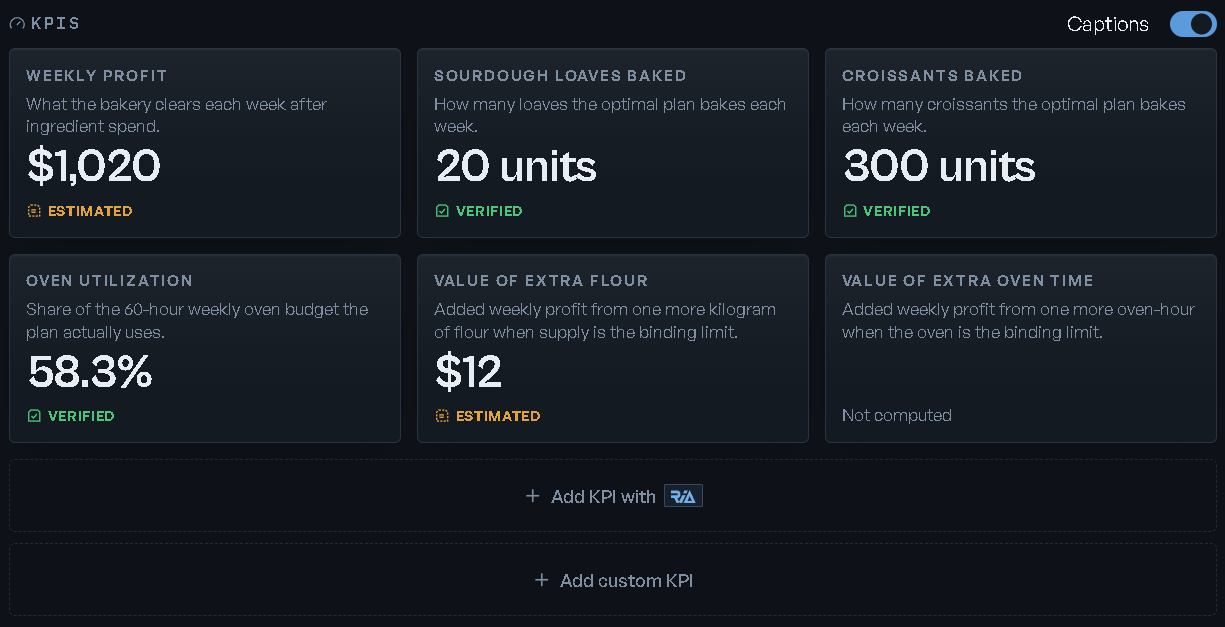
The KPIs section appears on both the model's Overview and the Scenarios screen, and it shows
the same KPIs for whichever scenario you have selected. Tiles come six at a time — View more
({n} more) and View less page through the rest — and you can drag them into the order you
want, which sticks for the model.
Each tile shows its label, its delta against Base, and the value. Deltas take one of three forms, all against base:
| Unit | Reads |
|---|---|
| Currency | +$420 vs base |
| Percentage | +3.2 pp vs base |
| Anything else | +12.00 units vs base |
A delta of zero shows no line at all — an "unchanged" label tells you nothing you could not
see. Large currency values abbreviate: $1.24B, $1.24M, and $12,345 from ten thousand up,
with the full figure on hover.
Where a KPI has no value for the scenario, the tile says Not computed rather than showing a dash that could read as zero.
Two marks can appear beside a label:
- Partial coverage — a warning triangle whose tooltip is the specific caveat, for example which items were left unpriced. A tile without it covers the whole model, so the absence of the mark is itself the statement.
- All types — this KPI has no per-type detail, so it is reporting across all types rather than the one you highlighted.
Captions is a switch, and it is off by default: the tiles lead with the numbers. Turn it on — "Show the caption line under each KPI value." — and each tile adds the sentence explaining what it means for your business.
KPIs belong to the model, not to the scenario you are looking at. Adding, editing, reordering or removing one changes it for every scenario in the model — the platform confirms this the first time you edit a KPI from the Scenarios screen. To define a KPI, see KPIs & custom metrics.
Verified and estimated
Every computed value carries a mark:
- Verified — "Verified — reconciled against the solve." The number came back from the optimization run and reconciles.
- Estimated — "Estimated — derived; open the KPI and run the trace to verify." The number was derived rather than read back directly, and a trace can upgrade it.
Inside Verify and the KPI trace the same idea gets a fuller badge with four levels — Verified, Estimated, Stale, Unverified — and the reasons behind the verdict as its tooltip.
Proving a number
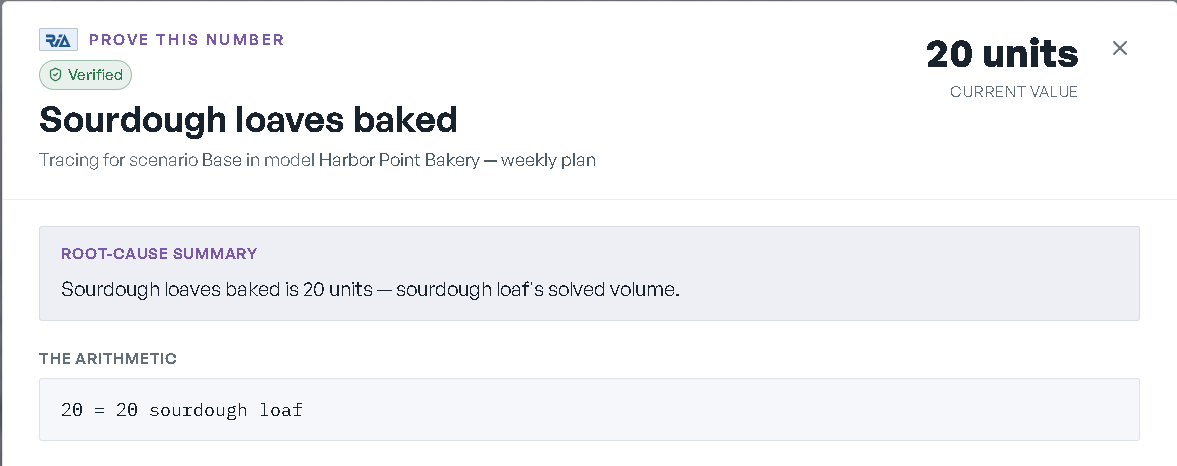
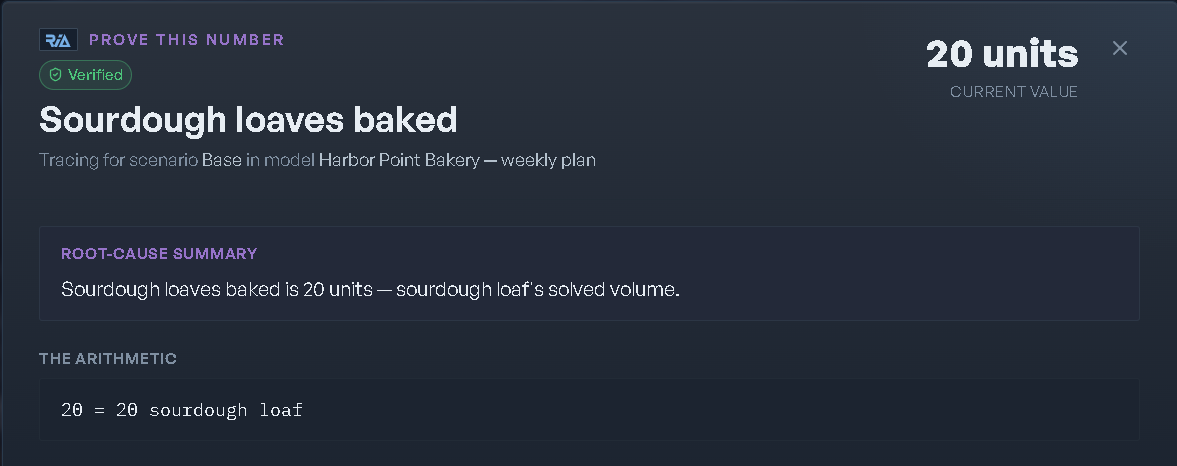
Click a KPI tile and the trace opens, headed Prove this number over the KPI's name, the confidence badge, and the value with its Base comparison. Where no trace has been cached, it starts building one.
Sections, once a trace lands:
- Partial coverage — if coverage is incomplete, the caveat sits above the number, not in a drawer.
- Root-cause summary — what produced the figure, in prose.
- The arithmetic — the formula, spelled out.
- Breakdown (
{n}) — the line items behind the value, with columns Line item, Active, Base, Δ, and Source. Composed against Base, the heading adds — Active vs Base. - What's setting this number (
{n}binding) — the limits that are holding the answer where it is, each with what it means, the level it is sitting at, and what one more unit of it would be worth.
Re-trace rebuilds the trace. Where the trace is thin, the footer offers Run full diagnostic instead, and says what that costs: loading the model, solving, and querying for the per-component breakdown.
The narrative
A solved scenario also explains itself in words — what the plan does, what it is worth, and which limits are binding. It renders in the scenario editor pane under the run button on Scenarios, and again in a workspace as the Executive narrative widget, footed with the scenario name and its objective.
The widget shows the scenario's own narration where it has one, the model-level summary on Base,
and otherwise a draft, etched Draft from RIA · not yet reviewed so nobody mistakes an unreviewed
draft for a reviewed one. With nothing to show on a what-if it says so: "No summary yet for
"{name}". Solve this scenario to get one, or ask RIA to summarize it."
"Binding" is the useful word in any narrative. A limit that is fully consumed is what is stopping a better answer — those are the levers worth attacking.
Where one more unit pays
The Opportunity values widget answers "what would more of this be worth?" It ships with the tile title Where to invest next, headed The next best move, and a Total unlocked (horizon) stat summing every move it found — not only the ones on screen.
Each row is a limit that is currently binding: its name, where it comes from (sales, resource, purchase or process), a sentence of explanation, the value of one more unit, that unit, and the total. Rows rank by total value, six at a time with more levers for the rest.
The widget is explicit about what its silence means. Where it lists everything, it says
"Anything not listed has zero opportunity: loosening that constraint wouldn't change total
profit." Where it is truncating, it says "Showing the {n} largest of {m}; the rest are smaller,
not zero."
Read these as the price you should be willing to pay for more capacity, not as a forecast. How firm they are is stated in Verify: unit values: exact or unit values: estimated, with compute exact to settle it — one extra solve with the plan's yes/no decisions locked in.
Financial statements
A solved scenario can report itself as financial statements. Add the Financial report widget to a workspace and it gives you:
- A statement control — P&L, Balance sheet, Cash flow.
- On the P&L, where a bridge can be derived, a Statement / Bridge pair. Bridge switches the table for a profit-bridge waterfall.
- Number scale — Whole $, $000, $M.
- CSV, which exports the statement as shown.
The caption above the table names what you are reading: {Statement} · horizon, or Balance
sheet · point-in-time. P&L and cash flow give columns Account, Amount and % rev; the
balance sheet gives Account, Opening, Ending, Δ and % assets. Reading aids are
stated on screen: "Click a subtotal's caret to collapse its lines. Negatives shown in
(parentheses)." Your statement, scale, table-or-bridge and folded-subtotal choices are remembered
per widget.
The balance sheet checks itself out loud — "Balances — Total Assets = Total Liabilities + Equity.", or "Does not balance — Assets ≠ Liabilities + Equity (check the model's chart of accounts)."
Statements are gathered from a re-solve of the saved model, so a solved scenario does not always have them yet. Two different empty states say which case you are in:
- No solved scenario yet — "Solve a scenario to see its income statement, balance sheet, and cash flow."
- No financial statements — solved, but nothing to show. The body names the reason, and where the situation is repairable it offers Collect statements. The reasons worth knowing: the model has no chart of accounts behind it to report on, so it produces no statements at all; the statements were collected but did not reconcile to the scenario's objective, so they were not stored; the engine could not re-solve the scenario's saved model; or the statements have not been gathered yet.
Statements that do not tie to the objective are not shown. Storing a P&L that ties to nothing is worse than showing none, so the platform discards them and tells you to re-run.
The separate Balance sheet & cash flow widget presents the same two statements side by side, sectioned Assets / Liabilities / Equity in chart order, with its own tie-out badge — "Balance sheet balances · Assets = Liabilities + Equity" or "Balance sheet does not tie out". Accounts carrying an authored interest rate or a covenant limit are annotated in place, with a mark on any line sitting exactly at its limit.
Comparing bottom lines
The Financials comparison widget puts the P&L for Base and your picked what-ifs side by side, captioned Income Statement · period activity · Δ vs Base, with Base first.
Deltas are coloured by profit impact, not by sign — a bigger expense reads as bad even though the number went up. A column whose scenario has no statements shows why in a short label, with an inline collect link where that is the fix, and renders its cells as a middle dot so an absent column can never read as zeros. A column that cannot honestly be differenced is labelled no Δ · not current, with its last successful figures still shown.
When there is no answer
An infeasible scenario means your requirements collide: no plan satisfies all of them at once. Diagnose on the Scenarios screen opens a workspace built around the collision, with widgets that lay out:
- a summary of the finding, and the caveats to read it with;
- which requirements could not be met at all, and the cause traced behind each;
- where the plan was met but strained — a shortfall, an overrun — and how much that strain cost;
- the highest-value relief moves, and the top lever and action for each.
The full constraint trace lives in the Infeasibility tree widget, which you add to the same canvas to drill in; from there, Create scenario with this fix turns a proposed relief into a what-if you can run.
Long solves
A solve that runs for hours reports on a clock, not on a commentary: Background solves on the
Home screen lists each one as "Solving — {elapsed} elapsed", because "Long solves run quietly;
elapsed time is the signal, not messages." Finished rows read "Solved — objective {value}", and
say so where the solved model itself was not kept. Failed rows carry the error. The panel is a
readout only — starting a solve stays with the scenario you run or with RIA.
Verify
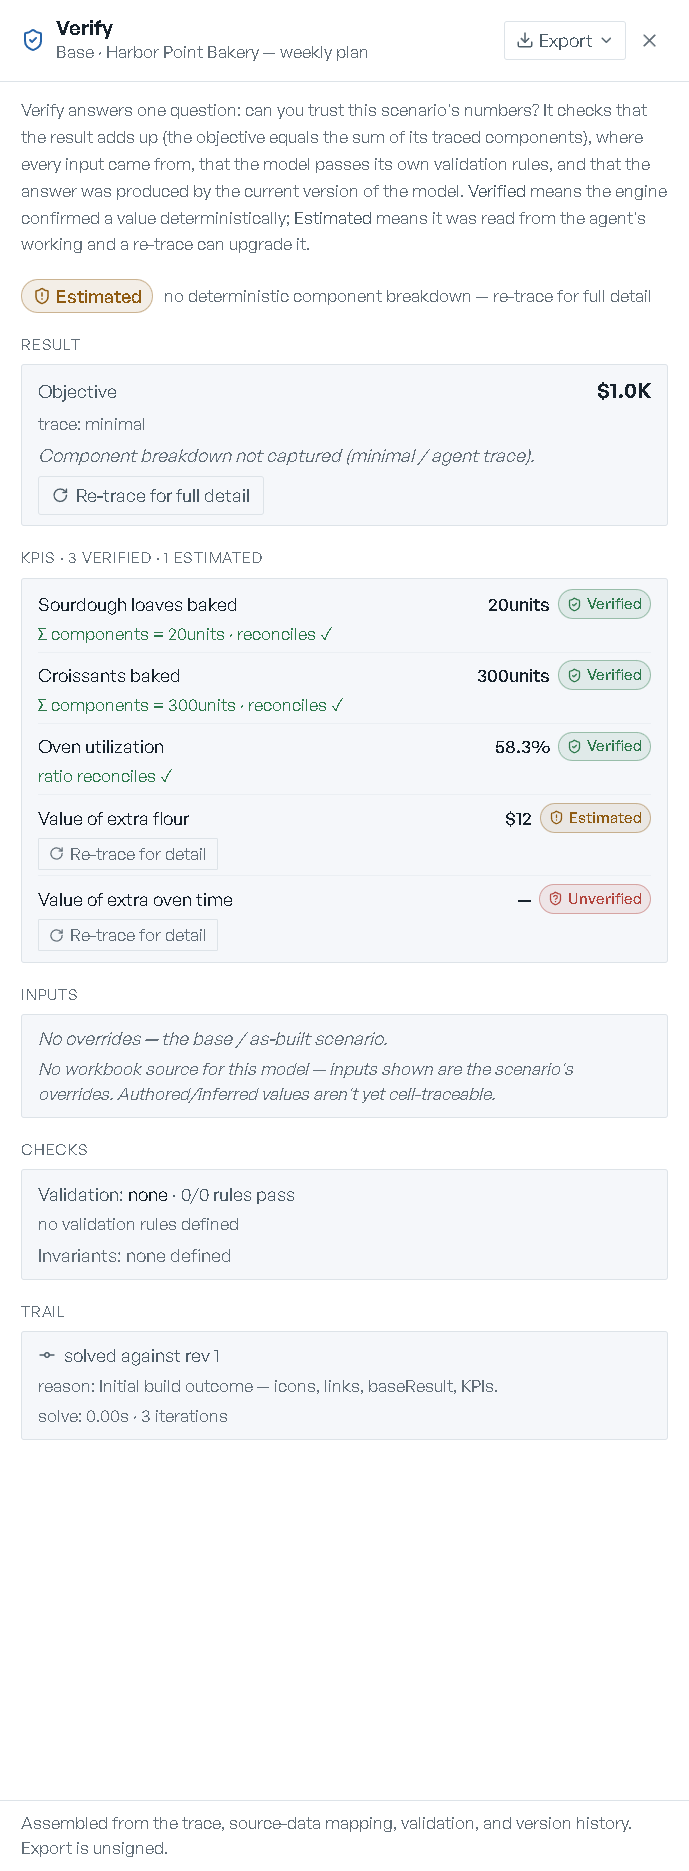
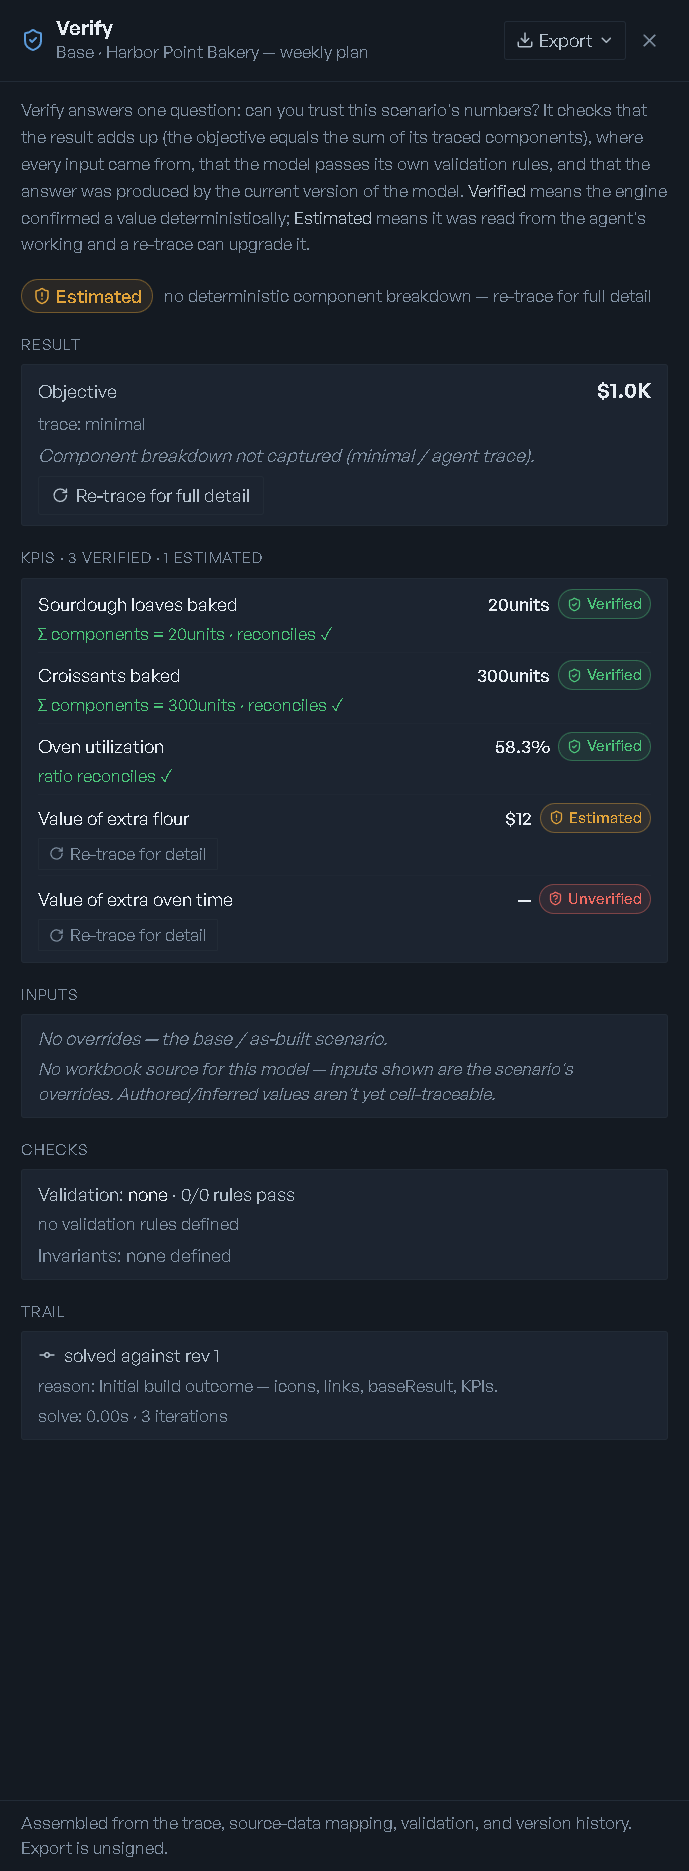
Verify builds the evidence record for one solved scenario, in a drawer headed with the scenario and model names. It opens by stating its own job:
Verify answers one question: can you trust this scenario's numbers? It checks that the result adds up (the objective equals the sum of its traced components), where every input came from, that the model passes its own validation rules, and that the answer was produced by the current version of the model. Verified means the engine confirmed a value deterministically; Estimated means it was read from the agent's working and a re-trace can upgrade it.
Five sections, in order:
- Result — the objective and where its trace came from, then the reconciliation: either the components sum to the objective, or the unexplained remainder is named and itemized. Where the breakdown was never captured, Re-trace for full detail upgrades the scenario from Estimated to Verified by re-loading the model, re-solving, and querying for the deterministic per-component breakdown. Binding limits are listed here with the value of one more unit, along with whether those unit values are exact or estimated.
- KPIs ·
{n}verified ·{n}estimated — one row per KPI with its value, its confidence badge, and its own reconciliation. Any KPI without a breakdown gets a Re-trace for detail button. - Inputs — every override as "
{parent}·{field}={value}" tagged ← you (override), and every workbook value tagged with the sheet and cell it came from. With none: "No overrides — the base / as-built scenario." - Checks — the validation status and how many rules pass. Where rules fail, a link to Open the validation report to see and fix the failing rules — see Validation & trust.
- Trail — which model revision the scenario solved against, whether that revision is still current, and the solve's own time and iteration count. On a stale trail, Re-solve against the current model brings the answer up to date.
Export is a menu with two formats — Evidence JSON and Evidence Markdown — for taking the record outside eode. The footer says what it is and is not: "Assembled from the trace, source-data mapping, validation, and version history. Export is unsigned."
RIA Review findings
On a workflow run, RIA Review tags each finding with where it came from and how sure it is. Provenance is one of rule, your edit, vs base, RIA, or the optimization run itself; confidence is certain, likely, or worth a look.
A caveat RIA raises about its own model is the system telling you where the model is thin. Read it before you act on the number.